Understanding Speed Maps in Horse Race Analysis
Speed maps are essential tools in horse race analysis, providing insights into how a race might unfold. These maps identify the likely pace scenario by predicting where each horse might be positioned during the race. Understanding how to read and use speed maps can enhance your ability to analyze races accurately. Knowing this can significantly impact betting strategies and increase the chances of making well-informed decisions.
What Are Speed Maps?
Speed maps are graphical representations used to assess the probable pace of a race and the running position of each horse. They take into account factors like past performance, typical running style, and speed figures to predict how horses will position themselves. By examining these aspects, analysts and bettors can visualize the race’s dynamics before it begins, offering a predictive overview that is crucial for strategic planning.
The Importance of Speed Maps
Speed maps serve several critical functions in horse racing. The primary purpose of speed maps is to anticipate which horses will lead, which will chase, and which will come from behind. This information is crucial because it influences betting strategies and race predictability. For instance, a horse that prefers to lead might struggle in a race with multiple front-runners. Conversely, a strong closer may benefit from a fast early pace set by others. Furthermore, understanding the map’s layout can enable bettors to identify potential conflicts, such as two strong leaders battling for the same position, which might open opportunities for other horses.
Predicting how a race will unfold allows for better risk assessment and the crafting of more sophisticated betting strategies. The positioning information provided can be a critical variable when determining which horse is likely to have a favorable trip. Consequently, speed maps are indispensable to serious horse racing analysts and bettors.
Elements of a Speed Map
Speed maps typically feature important components that convey a comprehensive picture of the race’s potential flow. By interpreting these elements, one can gain a better understanding of the possible race dynamics.
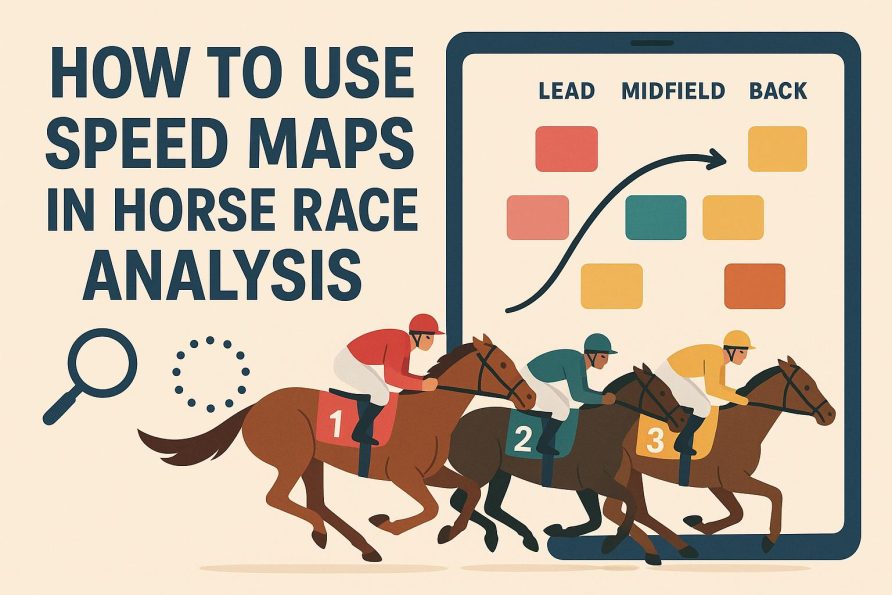
Horse Positions: Speed maps often display horses in rows or columns indicating their expected early, middle, and late-race positions. This representation helps to understand where each horse is likely to be during different phases of the race. For example, it might show certain horses taking an early lead, others maintaining a middle-ground position, and some waiting to make a late run.
Pace Prediction: The anticipated pace of the race is often described as slow, moderate, or fast. This information is crucial for understanding how the race might play out, as different horses perform better under varying pace conditions. A fast pace might tire out early leaders while benefiting horses adept at closing strong, whereas a slow pace can favor horses that lead or sit close by without expending much energy.
Rail Position: Some maps include information regarding the position of the rail, which can heavily impact strategy, especially in tightly contested races. The rail position can determine the horse’s ability to navigate the track efficiently, affecting their overall performance. Horses positioned closer to the rail often have shorter distances to cover, which can be advantageous in competitive settings.
Using Speed Maps for Betting
Incorporating speed maps into betting strategies involves evaluating how a horse’s expected position might impact its performance. For instance, a horse that typically runs well when leading may be at an advantage in a race with few front-runners. Similarly, betting on a strong closer could be wise if the map suggests a fast early pace. The speed map can be instrumental in identifying value bets, which are wagers offering more potential for profit relative to their perceived risk based on other market opinions.
Understanding the implications of speed maps can also help bettors identify horses that are likely to be overbet or underbet. If a speed map highlights a favorite who is likely to encounter unexpected pressure from others with similar running styles, it might be prone to an upset. Conversely, a less favored horse with a seemingly advantageous speed map position might offer better returns.
Additional Considerations
While speed maps are incredibly useful, it is important to consider the limitations and variables that could affect their accuracy. Factors such as track condition, jockey changes, weather, and unpredictable elements in race day implementation can alter the dynamics forecasted by a speed map. Understanding these factors can further refine the analysis and applications of speed maps in practice. Therefore, while speed maps offer valuable insights, they should be complemented with additional data and on-the-ground evaluations when making final betting decisions.
For those looking to deepen their understanding of horse racing analysis or seeking further strategies, resources available online can be highly beneficial. Take the time to study these tools comprehensively, applying them in various racing scenarios to enhance proficiency.
Incorporating speed maps into your horse race analysis can provide a more detailed understanding of the race dynamics, offering a competitive edge in predicting outcomes and making informed betting decisions. By utilizing the potential of speed maps, bettors and analysts can gain a nuanced view of the anticipated race flow, ultimately aiming for more strategic and successful outcomes in the complex world of horse racing. For additional resources on horse race analysis and betting strategies, you may consider visiting this website for more comprehensive insights.